Foreclosures Surge as U.S. Homeowners Face Rising Costs
Foreclosure filings in the United States have increased for six consecutive months through August 2025, rising 18% compared to the same period in 2024. Approximately 188,000 properties had foreclosure filings by mid-year, putting the country on track to surpass the 322,000 foreclosures recorded in 2024.
“Paying for the house, the car, the bills — I just couldn’t manage anymore,” said Draxler, who nearly lost her home to foreclosure three times over the past decade.
Foreclosure Filings in the U.S.
Foreclosure filings—which include default notices, scheduled auctions, or bank repossessions—have risen year-over-year for six straight months in 2025. As of August, filings increased by 18% compared to the same period in 2024, with approximately 188,000 properties entering the foreclosure process through June. This trajectory suggests the U.S. is on pace to exceed the 322,000 foreclosures recorded in 2024.
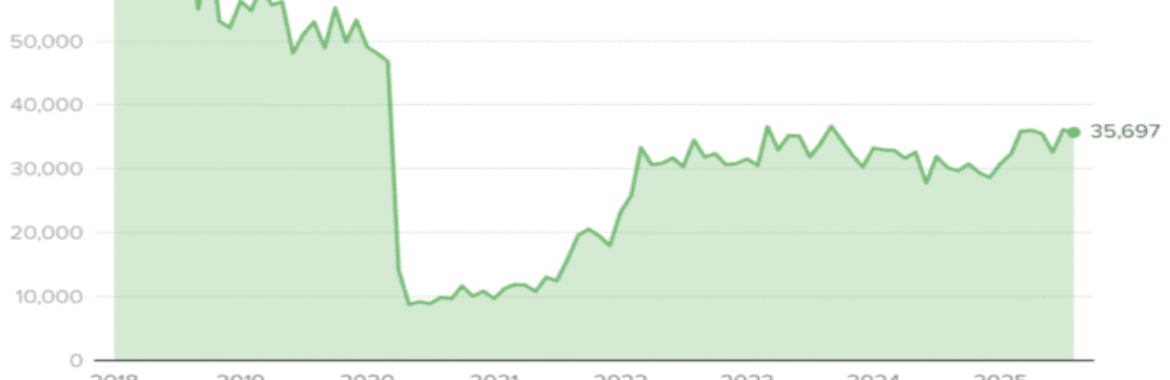
Foreclosure Filings Trend (2018–2025)
Data from January 2018 through August 2025

Key Data Points & Trends in 2025
1. Foreclosure Activity is Rising
In the first half of 2025, 187,659 properties in the U.S. had foreclosure filings, marking a 5.8% increase year-over-year. Foreclosure starts reached 140,006, up 7% from the same period in 2024. Completed foreclosures (REO properties) totaled 21,007, a 12% rise from the first half of 2024.
2. Quarterly and Monthly Trends
During Q1 2025, 93,953 properties received foreclosure filings, up 11% from Q4 2024. In the same quarter, 68,794 properties began the foreclosure process, a 14% increase over the prior quarter. Average time to complete a foreclosure decreased to 671 days in Q1 and further dropped to 645 days in Q2. In May 2025, lenders started foreclosure on 24,165 properties, while 3,844 were repossessed through completed foreclosures (REOs).
3. Foreclosure Rate Relative to Housing Stock
In H1 2025, about 0.13% of U.S. housing units had a foreclosure filing, roughly 1 in every 758 homes. States with the highest rates included Illinois (0.23%), Delaware (0.23%), Nevada (0.21%), Florida (0.21%), and South Carolina (0.20%). Q1 2025 ratios for worst-affected states were Delaware (1 in 761), Illinois (1 in 857), Nevada (1 in 874), Indiana (1 in 976), and South Carolina (1 in 1,021).
4. Differences Across Metros & States
Metro areas with high foreclosure rates include Lakeland (FL), Columbia (SC), Chicago (IL), Ocala (FL), and Jacksonville (NC). Some states experienced large year-over-year increases: Alaska (+55%), Rhode Island (+51%), Wyoming (+46%), Utah (+46%), and Colorado (+41%). Texas, Florida, California, Illinois, and New York had the highest number of foreclosure starts, while completed foreclosures were concentrated in Texas, California, Pennsylvania, Illinois, and Michigan.
5. Other Market Signals & Forecasts
Foreclosure starts rose 13% year-over-year in April 2025, and active inventory also increased, with monthly foreclosure sales reaching a 15-month high. While overall foreclosure activity remains relatively moderate, analysts caution that rising interest rates, adjustable-rate mortgage resets, inflation, and economic uncertainty could increase homeowner distress. For more details, see MBDailyNews. This news was provided by One West Realty .
Interpretation & What to Watch
Foreclosure activity indicates a gradual increase in financial strain among homeowners. Although current levels remain below historical peaks, the accelerated foreclosure pipeline suggests properties are being processed faster once defaults occur. Regional variation is significant, and homeowners in fragile markets may face heightened risk. Key factors to monitor include adjustable-rate mortgage resets, inflation, employment stability, and nonmortgage debt defaults.


